
5 Essential Python Libraries for Data Analysis

What should I prepare to start data analysis?
First, it is important to learn the basics of Python, which is the most widely used programming language for data analysis. You should also know the essential libraries that are often used. Among them, I will introduce the five most important libraries and review the characteristics, advantages, disadvantages, and simple codes of each library. Thanks to ChatGPT, you can use them sufficiently with just the basics, so shall we learn together?
📌 What is a library?
A library is like a superhero's utility belt. It pulls out the necessary functions to solve the mission smoothly. It's like starting with knowing what ingredients give what flavors when cooking.
1. Pandas
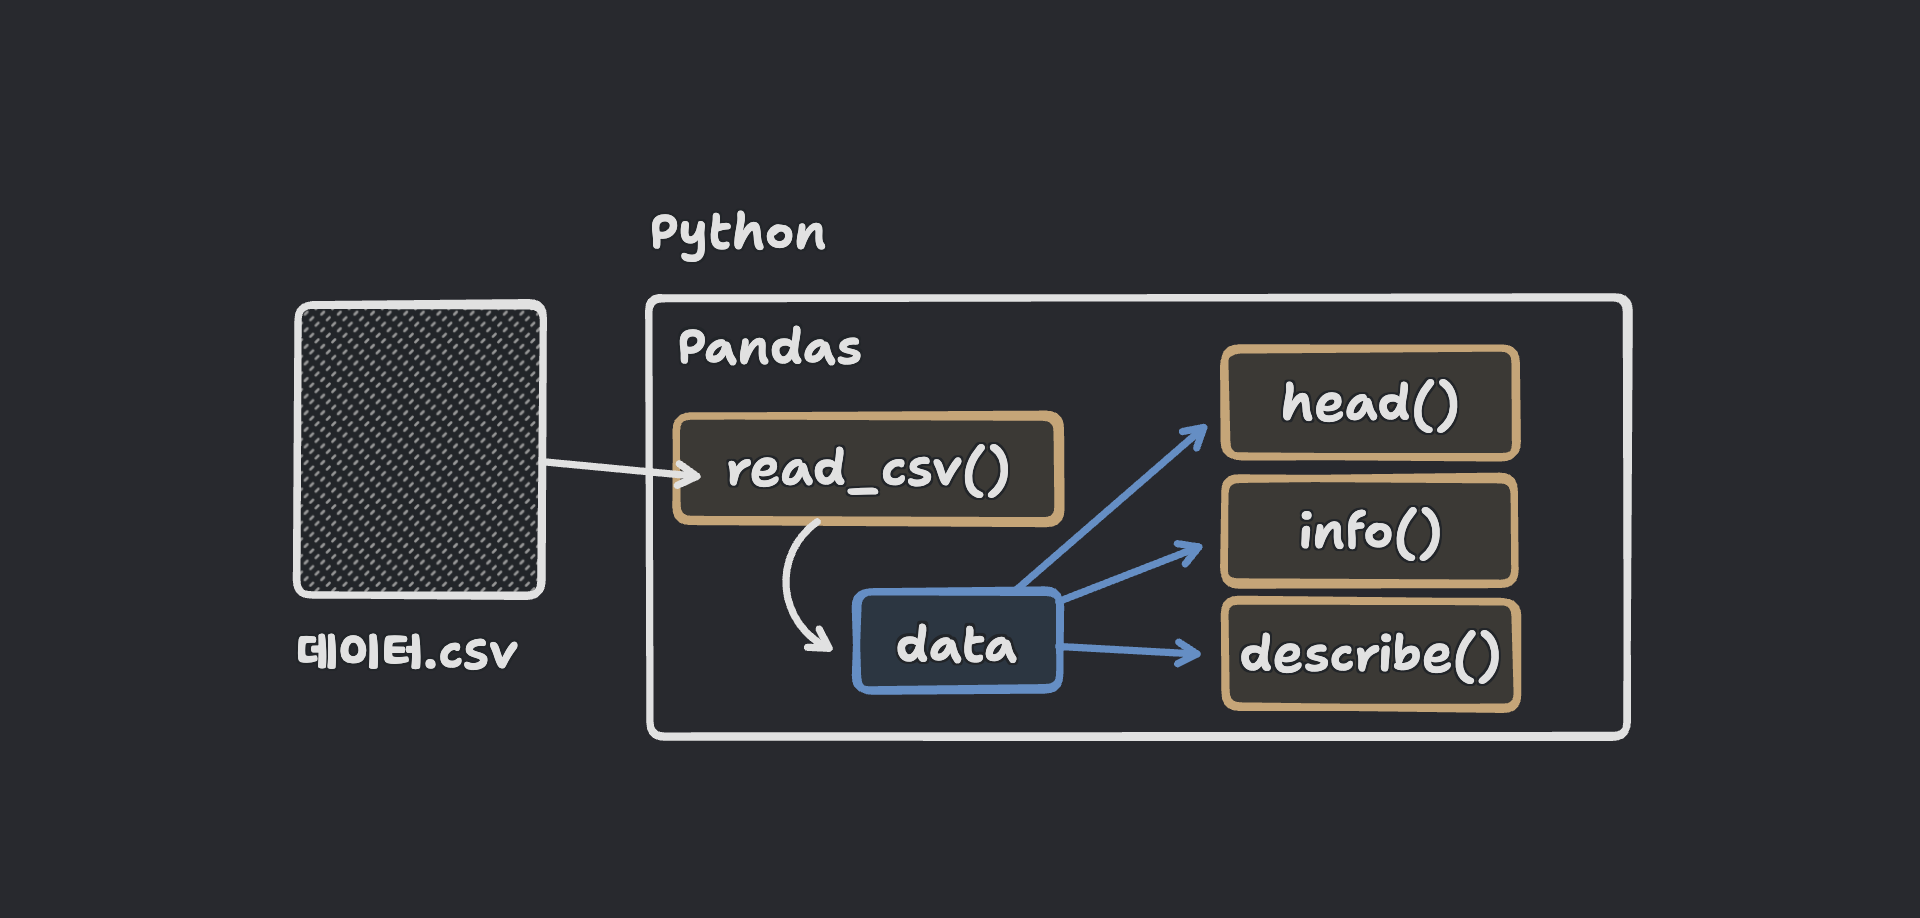
Pandas is an essential library for manipulating and analyzing data in Python. It can handle various file formats (CSV, Excel, SQL, etc.), making it a starting point for dealing with a wide range of data in Python.
Pandas: https://pandas.pydata.org/
Advantages
Designed to efficiently handle tabular data
Easy conversion to DataFrames
Intuitively performs operations such as filtering and aggregation
Efficient for processing large datasets
Excellent compatibility with various file formats (CSV, Excel, SQL, etc.) for easy data import and export
Disadvantages
Performance degrades when handling very large datasets as data is loaded into memory
Slower data processing speed compared to other C++ based tools
Example Code
# Importing the library
import pandas as pd

# Creating a DataFrame
data = pd.DataFrame({
    'Name': ['Kim Cheolsu', 'Lee Younghee', 'Park Minsu'],
    'Age': [25, 30, 35],
    'Job': ['Student', 'Company Employee', 'Teacher']
})

# Reading data
data = pd.read_csv('data.csv')  # Reading CSV file
data = pd.read_excel('data.xlsx')  # Reading Excel file

# Basic operations
print(data.head())  # Viewing the top 5 rows
print(data.info())  # Viewing data information
print(data.describe())  # Viewing descriptive statistics
2. NumPy
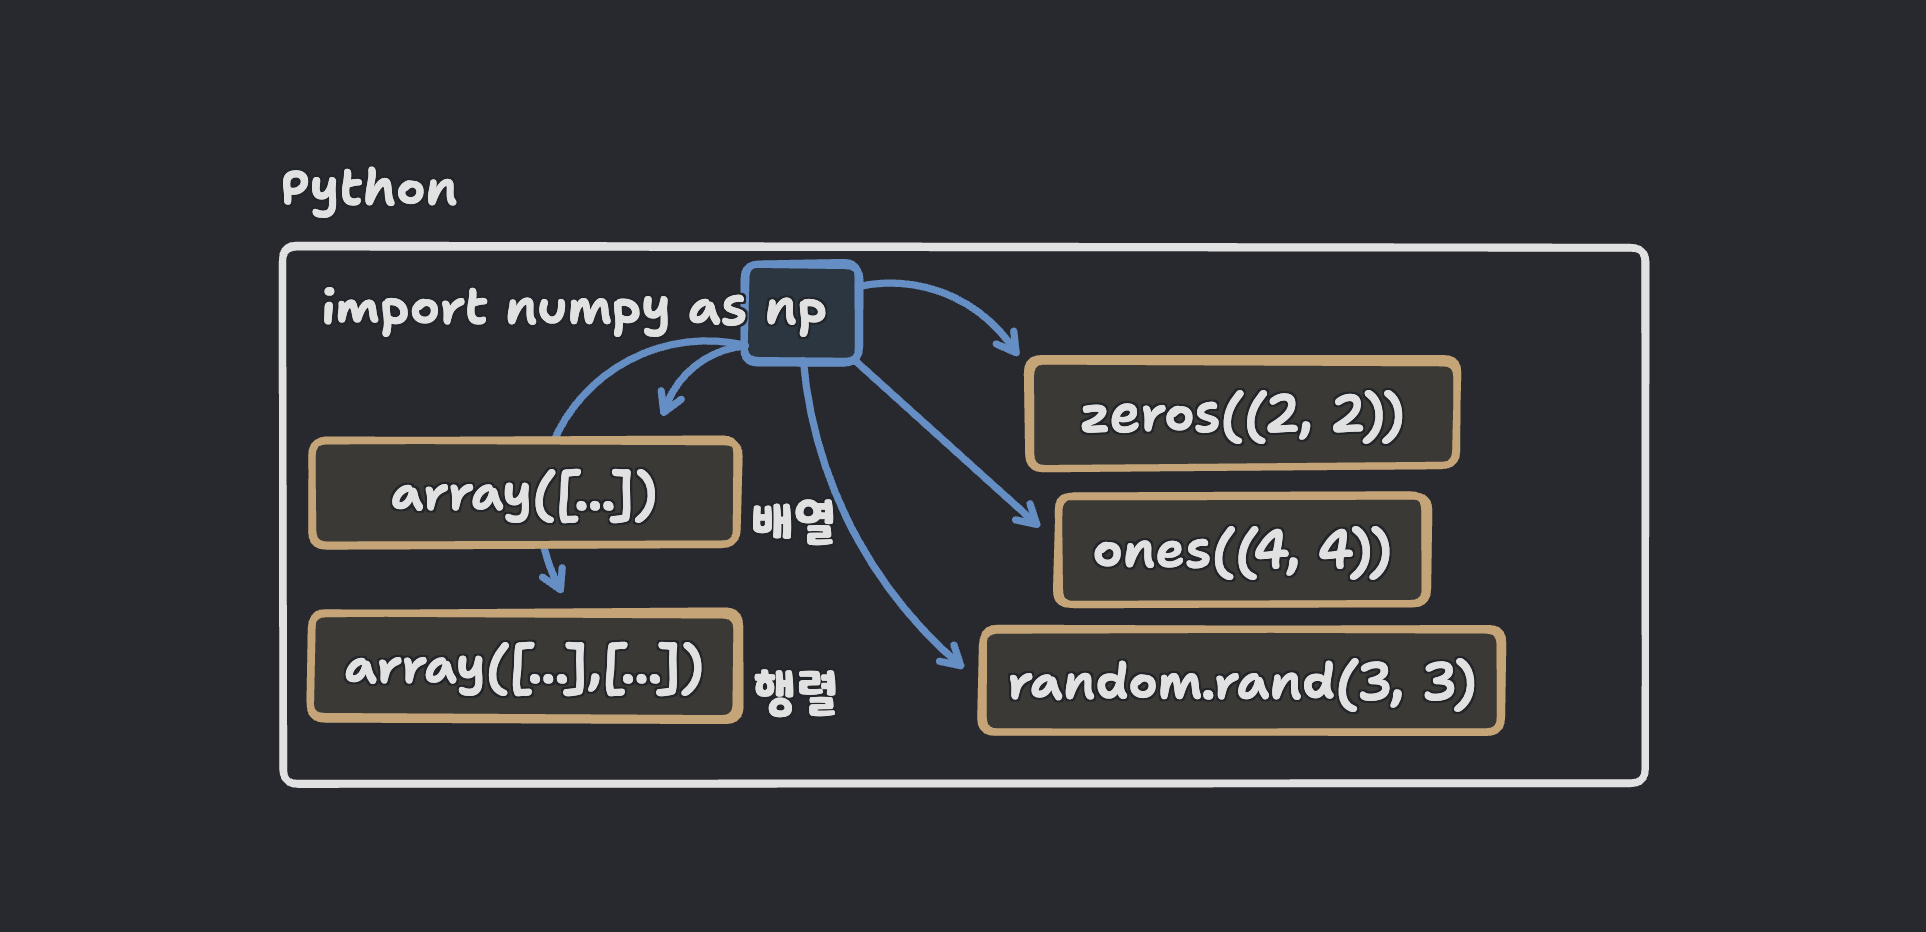
NumPy is a Python library for numerical computations. It supports array and matrix operations and is a basic computational tool for tasks in data analysis, scientific computing, and machine learning.
NumPy: https://numpy.org/
Advantages
Provides multi-dimensional array objects
Useful for fast computations and handling large datasets
Supports vectorized operations, providing higher performance than loops
Includes essential functions for scientific computing such as linear algebra and Fourier transforms
Disadvantages
More difficult to use for complex data analysis compared to Pandas
Cannot handle labeled data like DataFrames
Example Code
# Importing the library
import numpy as np

# Creating an array
arr = np.array([1, 2, 3, 4, 5])
matrix = np.array([[1, 2, 3], [4, 5, 6]])

# Creating special arrays
zeros = np.zeros((3, 3))  # 3x3 matrix filled with 0
ones = np.ones((2, 2))    # 2x2 matrix filled with 1
random = np.random.rand(3, 3)  # Random value matrix

# Basic operations
print(arr + 2)  # Adding 2 to all elements
print(arr * 2)  # Multiplying all elements by 2
3. Matplotlib
Matplotlib is a Python library for data visualization. It can create various graphs such as line graphs, bar graphs, and scatter plots, and allows detailed adjustments to the style and elements of the graphs.
Matplotlib: https://matplotlib.org/
Advantages
Easy to implement simple visualizations; structured in a way that beginners can easily learn
Disadvantages
The basic styles of visualizations are somewhat monotonous
Code can become lengthy when drawing complex graphs
Example Code
# Importing the library
import matplotlib.pyplot as plt

# Basic graph
x = [1, 2, 3]
y = [2, 4, 6]
plt.plot(x, y)
plt.show()
Example of a chart image created with Matplotlib: https://matplotlib.org/stable/gallery/index.html
4. Seaborn
Seaborn is a data visualization library designed based on Matplotlib. It has a similar usage to Matplotlib but features more concise and intuitive code.
Seaborn: https://seaborn.pydata.org/
Advantages
Designed based on Matplotlib, so the usage is similar
Easily creates statistical graphs (distributions, correlation heatmaps, etc.)
Beautiful and intuitive default styles
Directly linked to DataFrames, making it easy to derive insights from complex datasets
Disadvantages
Customization is more limited compared to Matplotlib
Example Code
# Importing the library
import seaborn as sns

# Setting basic style
sns.set_style("whitegrid")

# Drawing a distribution plot
sns.distplot(df['column_name'])

# Heatmap
sns.heatmap(df.corr(), annot=True)

# Scatterplot matrix
sns.pairplot(df)

# Boxplot
sns.boxplot(x='category_column', y='numeric_column', data=df)
Example of a chart image created with Seaborn: https://seaborn.pydata.org/examples/index.html
5. Scikit-learn
Scikit-learn is a Python library for machine learning. It provides various algorithms and tools for simple and efficient data analysis and modeling, and is widely used from beginners to experts.
Scikit-learn: https://scikit-learn.org/stable/
Advantages
Supports the entire process of machine learning, including data preprocessing, model training, and evaluation
Includes various algorithms, making it highly practical for real-world use
Easy to apply multiple models such as classification, regression, and clustering
Rich tools for evaluating and improving model performance
Disadvantages
Requires separate libraries for handling complex models like deep learning
Example Code
# Importing the library
from sklearn.model_selection import train_test_split
from sklearn.linear_model import LinearRegression
from sklearn.metrics import mean_squared_error

# Splitting the data
X_train, X_test, y_train, y_test = train_test_split(X, y, test_size=0.2)

# Training the model
model = LinearRegression()
model.fit(X_train, y_train)

# Making predictions
predictions = model.predict(X_test)

# Evaluating performance
mse = mean_squared_error(y_test, predictions)
print(f'MSE: {mse}')
We have looked at all the essential libraries needed for data analysis. I hope the organized information is well utilized and helpful.
📌 Summary
Pandas: The basic tool for data manipulation and analysis, supports various file formats
NumPy: Essential library for numerical computations and large-scale data processing
Matplotlib: Creates various graphs and charts for data visualization
Seaborn: Easily understands data distribution and relationships with advanced visualization
Scikit-learn: A powerful tool for building and evaluating machine learning models